
Arnia System
- Hive Monitors – one per hive;
- Weather Station – one per apiary;
- Monitor Gateway – one per apiary;
- User Interface – one per user;
Hive Monitors
- Brood temperature;
- Hive temperature;
- Hive humidity;
- Colony activity;
- Weight.
Weather Station
Monitor Gateway
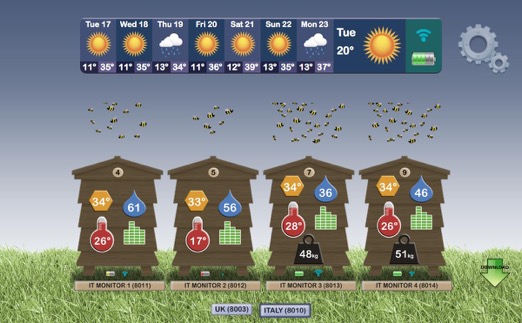
User Interface
- At the top, left to right, is weather data for the past week followed by battery status and signal strength;
- Interlocked cogs icon – far right – accesses User Interface Settings;
- The number of bees hovering over each hives indicates the degree of activity per hive;
- The different coloured icons pinned to each hive access detailed graphs of brood temperature, humidity, activity and the ambient temperature of each hive;
- The two hives on the right (below) are fitted with hive scales and the black icons access weight data.
How do you use it?
- Comparison
- Management
- Alerts
Comparisons
With a system like this which gathers and stores so much detailed information the possibilities for analysis and comparison are endless.
In addition, your own hive inspection data such as queen ID, colony assessment and appraisals, disease data, Varroa counts etc etc can all be added into the pot.
Comparisons between hives, between apiaries and between years are vital to both short and long term projects such as bee breeding, research and good old-fashioned curiosity.
Here are a few possibles:
- Comparison between hive types – poly or wood, commercial or national, mesh floor or solid in terms of humidity and temperature. This data could also be useful in conjunction with your own disease data i.e. chalk brood, Varroa, Acarine etc.;
- Comparison between colonies in terms of timing and speed of build up, activity, colony size, swarming behaviour, honey production – very useful when selecting breeding material – especially in conjunction with queen lineage information;
- Comparison between apiaries – to pinpoint best aspect, altitude, temperature, shade etc to maximise productivity vs swarm reduction etc.;
- Comparison of weight data between years in conjunction with weather data and times of day when foraging is at a peak could help pinpoint tantalising stuff like the ideal weather for fickle nectar flows such as hawthorn or heather;
Management
Monitoring can give indications about what is happening out there in your out-apiaries and what you might be needing in terms of equipment, time and energy. Weather data can be used to see if it’s worth going at all!
- Queen Status
Brood temperature is steady at 34 degrees C and is tracked by the monitors. This means you can spot a failing queen and/or monitor a virgin to see when she gets going and see that she keeps going. How annoying that is, when you find that the new queen you thought was going like a train and had left alone accordingly actually fizzled out two weeks ago.
Sudden erratic brood temperature also occurs if the queen gets into the supers – that’s annoying too – specially when she puts 2,000 eggs per day into your precious cut-comb?
If you treat your bees mid-winter with oxalic acid you will know that it is vital that the bees be broodless and the hive monitor will tell you this. Even if you were to monitor only your strongest hive going into winter it would give you some idea of the state of the brood in the others.
- Weight Data
- Activity Data
Acoustic data can be used to detect robbing. I’ve heard it said that robbing doesn’t matter – you’re going to take the honey anyway but that’s not quite the point. For a start, the robbing might be by somebody else’s bees!
The other evil with robbing is that it can lead to the death of a nuc headed by a valuable young queen. It’s something that needs to be be nipped in the bud that is for sure. Early detection could be very useful.
Downloadable Data
SMS Alerts
Now this could be very useful.
A variety of systematic SMS or text message alerts can be set up by the user to warn of things such as unstable brood temperatures, humidity or sudden increases in weight which can indicate robbing or a prodigious flow.
Automatic SMS alarms will also go out when a monitor detects something such as theft of a hive or when a hive is overturned. Hives are often overturned in winter when branches fall or stock get in amongst; if the boxes burst asunder the bees can die of exposure if not found quickly. Like taxes and death – thieves are always out there!
As luck would have it – Arnia.co.uk have lent me a monitoring kit so a road test will follow. Watch this space…
Click here for more about Remote Bee Hive Monitoring and applications
Click here for How to Set up your Hive Monitors
Click here for How to Install your Hive Monitors
Click here for Arnia Remote Hive Monitoring – First Data
Click here for a video overview of the Basic Hive Scale
Click here for video instructions on how to assemble your Basic Scale
Click here for how to make your own scale hive
Click here for more about scale hives
Click here for Remote Hive Monitoring Action
Click here for Useful Arnia Hive Scale Data
Thank you for your fabulous blog post on our technology.
We hope you find it useful in managing your colonies and would love to hear where the technology came in really handy.
Thank you for the loan.
I hope to have the system set up and running by the end of the week.
Technology here we come!